

Background
On the 14th May 2010, the UK Prime-Minister David Cameron made a commitment to make the new coalition government the 'greenest government' ever. His commitment included cutting carbon emissions by 10% across central government in the first 12 months and a promise to publish on-line real time emissions data from 18 headquarter buildings as part of a Carbon Reduction Commitment Energy Efficiency Scheme.
The Challenge
In June 2010, the Home Office issued a requirement for a Real-time Online Energy Reporting system for Home Office HQ at 2 Marsham Street. This would comprise upgrading an existing Carbon Viewer to display energy consumption in real-time for both the public and Home Office staff. This was installed by TR Control Solutions (TRCS) and was followed by similar systems in five major Whitehall HQ buildings, the ONS HQ in Newport and a further thirteen central government buildings.
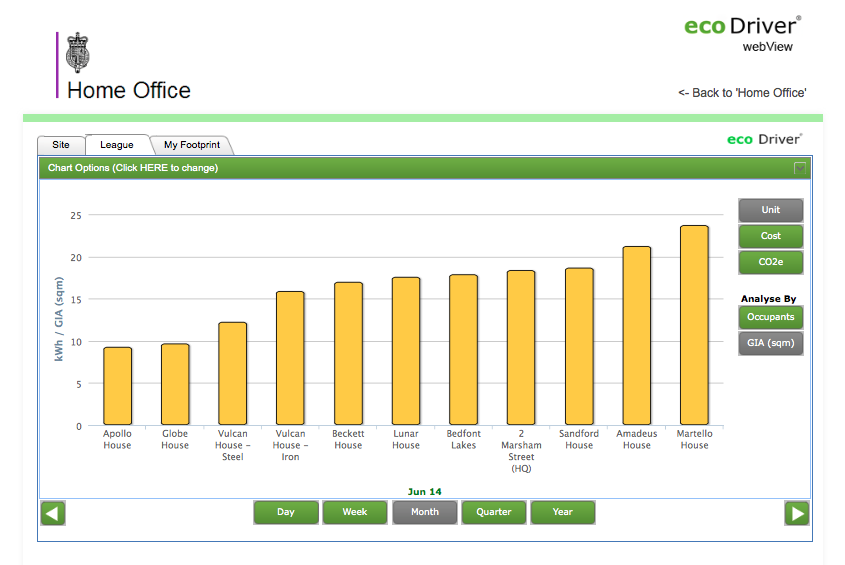
In 2012 the Home office asked TRCS to develop a real-time league chart to display the relative performance of ten key Home Office sites. The Site League chart went live in October 2011 and it is now possible to compare the energy consumption of all the sites with the data normalised by the number of building occupants. Subsequently waste disposal reporting and a 'My Footprint' chart were added to the system to personalise the energy and waste performance of each building.
The Solution
TRCS used their in-house developed application, eco|Driver®, to design, build and implement an interactive, web based portal and a local LCD display system that exceeded the expectations of the most prominent Whitehall departments in central London.
Each department has a bespoke webpage embedded with an interactive chart that graphically displays both live and historical energy, cost and emissions data with associated targets. Users are able to select sites, meters and time periods and switch from energy consumption data to cost or CO2 emissions.
Each department also has access to a local LCD display application that displays live and historical energy cost and emissions data supplemented with embedded presentations, images, tips, alerts and video.
This system utilises the .NET framework and Silverlight® technologies for the display as well as SOAP to exchange data between the LCD display application and the ecoDriver® server. The display system also makes use of unique embedded PowerPoint® functionality that enables the display to be embedded with a standard PowerPoint® presentation.
Data is gathered every 30 minutes from the main utility meters at 2 Marsham Street and daily for nine other buildings. Energy consumption is displayed for the day, previous day, the week, month, quarter and year. The carbon dioxide emissions and the cost of consumption are both shown.
The Result
In the six months following the installation of the RTD at 2 Marsham Street, the Home Office achieved an approximate cost saving of £11,400 and reduced carbon dioxide emissions by 120 tonnes.
By enabling the Home Office to introduce an indication of personal energy use and to encourage staff to compare their energy use with other departments via the site league chart, TRCS is helping government in its objective to get their staff to actively consider their own impacts and alter their behaviour.
Partner insight
TR Control Solutions have been delivering cost effective IT solutions that deliver competitive advantage to the public sector, multi-nationals, industrial organisations and small/medium enterprises, globally, since 2004. eco|Driver® is an award winning, cloud based sustainability information management system, designed to engage building users and facility management professionals in energy efficiency initiatives.
Bramble insight
Bramble Hub are specialists in helping ICT companies secure public sector contracts through UK Government frameworks. We have a large network of SMEs and niche specialists to meet all ICT requirements.
To find out more about being a Bramble Hub partner email us or phone 020 7735 0030